Comparative Report by Sub Category
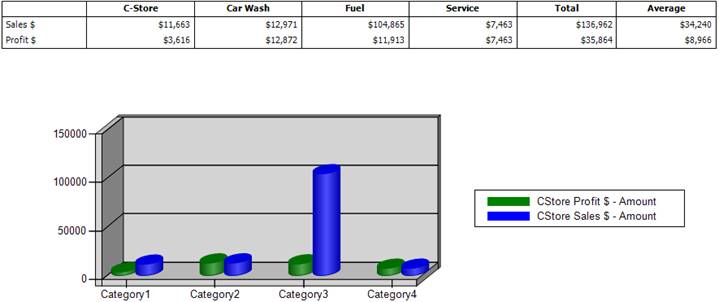
This report allows you to view different categories side by side in a chart as well as in graph format. As shown below, C-Store, Car Wash, Fuel and Service categories are selected for Jan. 1-7.

As you can see below, Sales and Profits are shown side by side and in a graph for the selected categories and date range.
