Comparative Report for Different Periods
These reports allow you to view data for one or all stations for up to 3 different periods. The periods cover the same number of days. Select the start dates for each period and enter in the number of days you want the report to cover then click ‘View Report’.

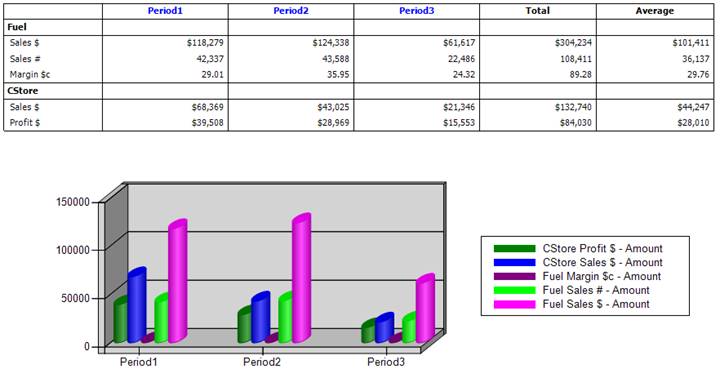
The three periods selected above are shown here. Notice it provides a total for Sales, Margin and Profit as well as averages for all 3 periods. A graph is also shown so you can easily see the difference between the periods.
