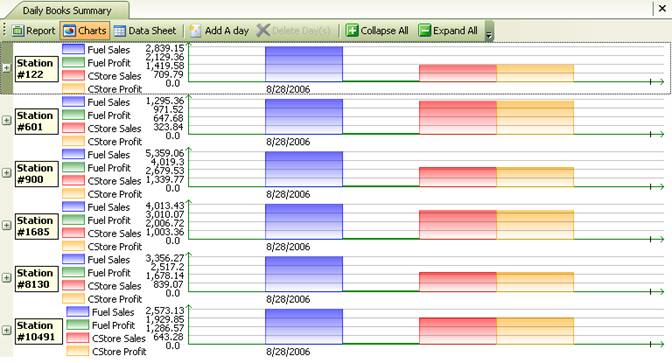
Sales Summary Chart for selected stations and date range

This option allows you to view sales data in a variety of charts and pie graphs. You can expand for each station to view more specific data including pie charts with C-store sales divided by department.
