Sales Analysis Charts
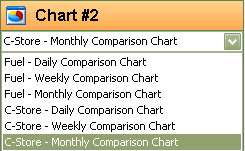
Choose from a list of reports to analyze daily, weekly or monthly fuel and c-store sales
Detailed Sales Analysis can give you a breakdown by department so you can see exactly where the problems and trends exist by both quantities and dollars sold.
Comparisons are:
1) Same day to same day last week.
2) Last 7 Days with the previous 7 Days
3) Last 30 days with the previous 30 days.
Customize to view and analyze Volume, Revenue, Profitability, Fuel and Cash Sales and see changes over set period of time.

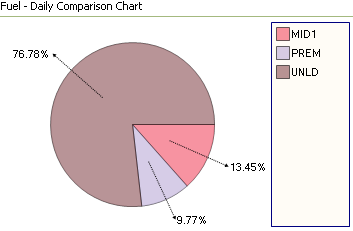
The Daily Fuel Sales Comparison Chart allows for easy comparison for sales of each fuel grade.

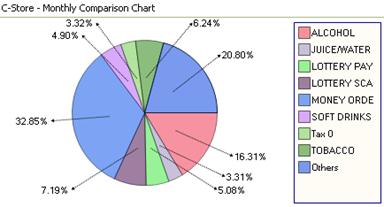
The Monthly C-Store Comparison Chart shows c-store sales by department so you can tell where most of your sales are taking place.
